organizational chart??? what is it?? may be u will have some question about it,, but, actually you have been found it if u came to organization or company,, lets talk about it more detail friends :D
**Organizational Chart Basic Knowledge**
What's an Organizational Chart
An org chart is the same thing as an organization chart.
The term org chart refers specifically to the chart used to track human
resources for the accurate management of human capital.
Organizational Chart Definition
An organizational chart is a chart which
represents the structure of an organization in terms of rank. The chart usually
shows the managers and sub-workers who make up an organization. The chart also
shows relationships between staff in the organization which can be:
- Line - direct relationship between superior and subordinate.
- Lateral - relationship between different departments on the same
hierarchical level.
- Staff - relationship between a managerial assistant and other
areas. The assistant will be able to offer advice to a line manager.
However, they have no authority over the line manager actions.
- Functional - relationships between specialist positions and other
areas. The specialist will normally have authority to insist that a line
manager implements any of their instructions.
In many large companies the organization chart can be large and incredibly
complicated and is therefore sometimes dissected into smaller charts for each
individual department within the organization.
There are three different types of organization chart:
- Hierarchical
- Matrix
- Flat
An organizational chart is a diagram that depicts the
structure of an organization in terms of relationships among personnel or
departments. An organizational chart also represents lines of authority and
responsibility. Generally, an organizational chart is a horizontal or vertical
tree that contains geometric shapes to represent staff or divisions. The lines
that connect the shapes indicate relationships between the positions. An
organizational chart indicates the formal structure of a business or company.
Most often, a rectangle represents a person, position,
or department. In a hierarchical organizational chart, the Chief Officer or
President is the top rectangle. The level underneath the chief officer contains
high-level managers or executives, and each succeeding level includes the
subordinates of the line above.
In standard organizational charts, the shape is similar
to a pyramid. Often, box size is relative to the authority level of the
position; for example, an executive position may have a larger rectangle than a
subordinate position. Peers generally have boxes of similar size on an
organizational chart. Lateral positions on an organizational chart indicate a
relationship between departments on the same level of hierarchy in the
organization.
In a standard organizational chart, solid lines depict a
formal and direct relationship between positions. A double linked rectangle
might indicate a situation with co-supervisors. A dashed line indicates an
advisory or indirect relationship between positions, while arrows indicate the
flow of communication. To indicate job sharing or dual responsibilities, a
divided box might be used. An open position is sometimes represented by a dashed
border surrounding a rectangle, or a box containing either TBH (to be hired) or
TBD (to be determined).
Because in a large company, the organizational chart can
be space-intensive and complex, smaller charts may be utilized to represent
individual departments. Other common space-saving techniques used in
organizational charts include a staggered tree method, a columnar stack, or a
list style which provides names or job titles rather than boxes. To avoid the
frequent need to update an organizational chart, you might use position titles
rather than the names of individual staff. Due to the changes in organizational
structure, an organizational chart is not always up-to-date.
To create an organizational chart, you can use
Organizational Chart software. Microsoft Word has a Diagram Gallery to create such a
chart, and Microsoft PowerPoint and Publisher have similar capabilities. The use
of software to create an organizational chart makes revisions and additions
simple.
Human Capital Management
Effective management of human capital is essential for
staying competitive. It is the goal of every forward looking company to decrease
costs and increase efficiency. At the most fundamental level of managing human
capital, you must have an org chart.
See the Benefits of Effective Human Capital Management:
- Identify key employees
Allocate your resources in the most efficient manner. An org chart will help you identify key personnel and put them in a position to maximize their effectiveness - Assess your organization
Evaluate the hierarchical structure of management and delineate clear paths of authority and responsibility. This will assist in creating a dynamic environment where employees understand their role within the organization and work together to further the goals of the company - Develop and strengthen key areas
of the organization
An org chart will show you the strong areas of the organization and identify parts that need to be reorganized for effective and efficient results
- Create a dynamic environment
Energize the company with effective management of human resources. With an org chart you can instantly reorganize the priorities of the organization to deal with changing markets and competition. Today's fast paced environment demands the ability to immediately allocate resources where they are needed.
Limitations of an organizational chart
There are several limitations with organizational charts:
- It only shows 'formal relationships' and tells nothing of the pattern of
human (social) relationships which develop.
- It shows nothing about the managerial style adopted (eg autocratic or
democratic)
- It very quickly becomes out-of-date, especially in large organizations
who change their staff regularly.
Chart showing the interrelationships of positions within an organization in
terms of authority and responsibility. There are basically three patterns of
organization: line organization, functional organization, and line and staff
organization.
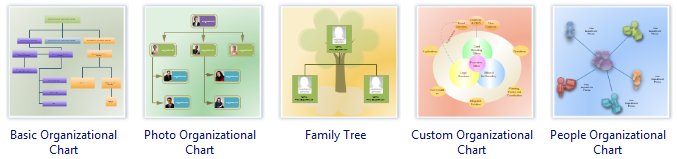
How to Draw Organizational Chart
The easiest way to draw a new org chart is by starting
with an organizational chart
templates.
Simply choose New from the File menu, then select from the vast array of flowchart examples available at your fingertips under the Samples Pane.
Templates and examples listed under this category have all the special settings for grid snaps, line- and shape-linking, wizards, and other crucial attributes that make it easy to draw a flowchart.
You can start with an example that closely resembles your project or you can start with a blank page by choosing New Document.
To choose a template, double-click on it.
credit: http://www.edrawsoft.com/Organizational-chart.php
organization charts are basically created to structure a company. It helps to understand the work flow and other major factors.
BalasHapus